What is the Difference between Social Media Benchmarks and KPIs?
7 MIN READ
Social media benchmarks and key performance indicators (KPIs) are all ways we measure marketing success, so they’re basically the same thing, right? Think again! These two metrics are different yet interconnected. Both play an important role in social media analysis and are used to not only determine the overall health of a program, but to make informed decisions for ongoing improvement. They’re essential when it comes to building out a successful marketing plan for your lifestyle brand.
Why You Should Care About Social Media Metrics
Many social media programs live and die by data—or lack thereof. This is especially true when annual budget reviews come around. We’ve found that programs that do not have a clear picture of where they’ve been and where they want to go, in terms of social media metrics, have a harder time justifying why they exist. When you can’t clearly articulate your team’s value, budget often isn’t approved and you’ll subsequently lose any marketing progress you’ve made over the past year. This is especially important during an economic downturn or recession—kind of like the one we’re in now.
So, what are the performance numbers that you should be paying attention to and who decides if those numbers are good enough?
There is no shortage of social media metrics—likes, clicks, shares, comments, video views…we could go on for a very long time. But what you pay attention to will depend on your program and goals. If video isn’t something you’re currently investing in (which really isn’t a good idea), video views aren’t going to be high on that list. What you pay attention to also depends on what your competitors are doing to drive audience engagement in the industry.
And this is where we get into social media benchmarks and KPIs. As a brief refresher—social media benchmarking is the process of comparing your performance metrics to a baseline, which is usually determined by industry bests and competitor activity. It is the external compass you use to guide your program and ensure that you do not lag behind others in the industry. And if that’s not enough, here’s a full-blown refresher on social media benchmarks and how to set them.
As for KPIs, they are the internal goals that you’re striving to achieve for your social media program. Examples of key performance indicators include:
How many followers do you want to reach by the end of the month or year?
By what percentage do you want to increase your overall engagement?
How many videos do you want to create and publish?
The Relationship Between Social Media Benchmarks & KPIs
To a certain extent, your social media benchmarks will inform your KPIs. If all competitors in your space have an average engagement rate of, say, 2.5% on Facebook, that will most likely be a target that you want to work towards. The growth in engagement rate for that KPI is the difference between where you’re at now and 2.5%. Said another way:
Competitors X,Y, and Z have an average engagement rate of 2.5% while your company (Company A) has an engagement rate of 2.1%.
KPI for Company A: 2.5% Engagement Rate
Engagement Rate KPI Target Growth for Company A: 19% increase
But KPIs should not only be influenced by outside benchmarks. They also need to be developed with your resources in mind. Going back to the video example, Competitor X may have average video views of 2,500 views per video, but if you do not have the resources to create videos, don’t make video views a KPI. That is merely an exercise in frustration.
However, you can use that information to determine overall program activities. Perhaps in the new year you want to emphasize video (which you should) and de-emphasize GIFs (which you also probably should) because you now have outside proof that videos work.
An in-depth look at how social media benchmarks and KPIs differ but have an inseparable relationship.
How To Define KPIs
Make sure they are SMART
The best KPIs will be Specific, Measurable, Attainable, Relevant, and Timely. Structuring your goals in this manner will help ensure that you achieve them. Studies show that we don’t do very well with vagueness. Kat Boogaard wrote about SMART goals in detail for Atlassian, and it’s worth a rereading.
Understand the history
Take a look at how your program has performed over time. Is your average follower growth rate steady between 1-2%? If you’re not planning to make any significant changes to your program activities that would boost that rate, we recommend against setting a follower growth KPI higher than 2%.
Determine your priorities
What business impact do you want your program to make and how will you go about making it?
Is there a strong need for brand awareness?
Does this year’s company goal center around conversions?
If the priority is brand awareness, perhaps you focus resources on paid social media targeted to new audiences that will increase your engagements and, therefore, increase your engagement KPI. If you want to achieve newsletter signups, you may decide to create content specifically explaining why followers should give you their email.
Understand how to measure your KPIs
Sometimes, it’s not just a simple matter of pulling up your Instagram or Twitter insights and looking at a number. What you’re trying to measure will determine how you measure it, and to a certain extent, what tracking and tagging will need to be in place before you start collecting data.
How to Measure KPIs
When it comes to measuring KPIs, there are a number of different ways to do this for any given metric. We’ve outlined two examples of social media KPIs below that are not as obvious as the normal likes or shares and how we recommend you go about measuring them.
Before you begin your calculations, determine a tool or method that you will use to help you aggregate metrics from your various social media platforms, so you can accurately build an overarching picture of your program. If you use a scheduling tool to manage all of your channels (Sprout, Later, etc), it will most likely have the capability to provide an overall snapshot along with growth rates. However, chances are they won’t cover everything you need and that’s where a spreadsheet will come in handy.
Measuring Social Media Web Traffic
For this first example, we are referencing web traffic specifically from social media. While Google Analytics does break out social referral traffic, its out-of-the-box granularity does leave a bit to be desired. To better categorize your social referral web traffic by earned, owned, and paid social media, implement UTM tracking.
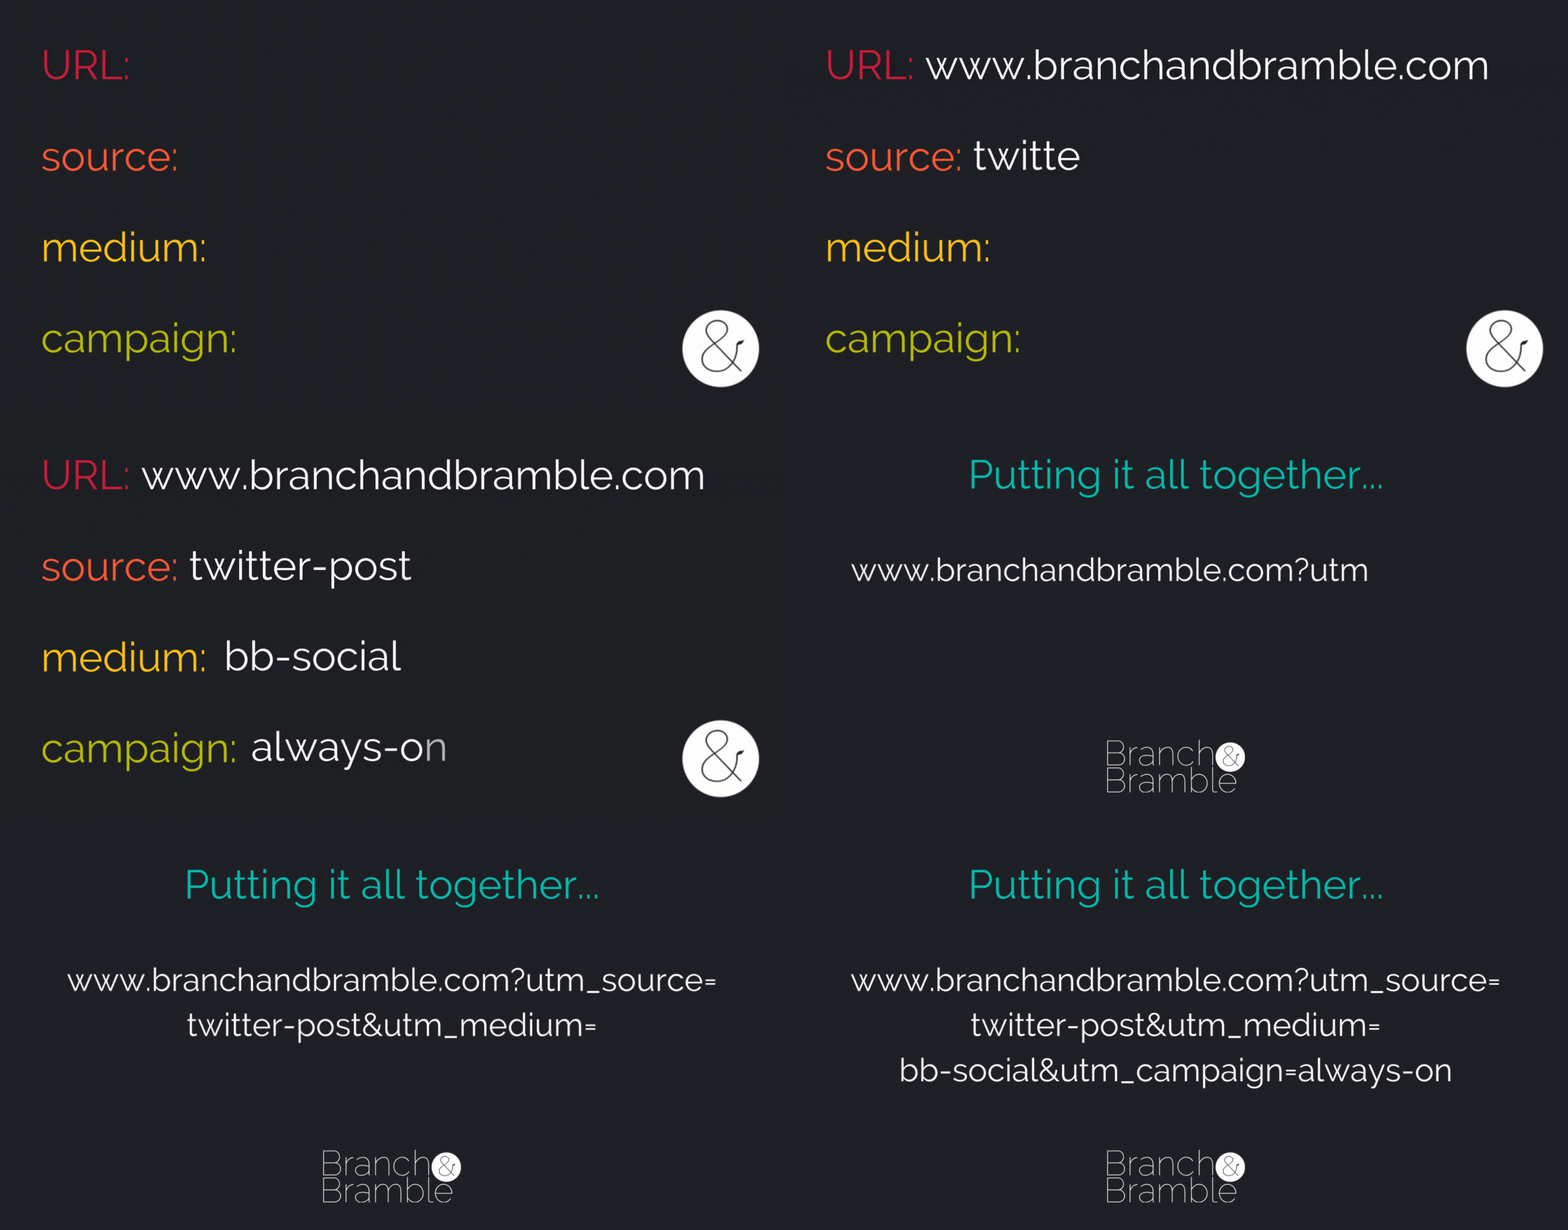
There are three components to building out UTM tracking that must be included for accurate reporting:
Source covers the platform as well as the type of post you’re publishing. A basic rule of thumb is “platform-type,” and this can extend outside of social platforms if need be.
twitter-post
twitter-paid
facebook-post
facebook-paid
blog-post
blog-advertorial
Medium is the general category of the traffic source. In this case, it would be social. We like to combine the general “social” source with the specific brand social profile.
influencer-social
brandname-social
partner-social
Campaign is just that, the name of your campaign for a marketing initiative, product, partnership.
special-brand-sweeps
always-on
More of a visual person? Here’s an example of what a tracked URL will look like.
Make sure that your tracking syntax uses lowercase and hyphens between words. The hyphens allow us to more granularly filter multiple sources and mediums. Say, for example, we want to see how much referral traffic was received from social but also which social profiles are the most effective at driving these referrals (brand profiles, influencer profiles, partner profiles). A hyphen will allow us to splice and dice the data both ways. Most importantly, stay consistent. If you change up the ways you hyphenate or refer to different sources, mediums, or campaigns, the tracking will be inconsistent and difficult to measure.
Once you have tracking in place and said tracking is added to every single link that directs back to the brand website from social media, you can then create custom channel groupings within Google Analytics to separate out owned, earned, and paid social referral traffic. From there, it’s much easier to determine if the program is meeting the set KPIs and overall growth metrics.
measuring social media engagements / engagement rate
Many reporting tools might already give you this, but we recommend looking into how this metric is calculated. What does the tool consider an “engagement” and does it differ from your definition?
Twitter includes profile clicks, media clicks, hashtag clicks, detail expansions, and a host of other things in their engagement rate metric. We like to focus on the engagements that show a more focused intent toward interacting with a brand—URL clicks, retweets, replies, likes. Hashtag clicks, for the most part, do not have a strong intent signal as they direct away from deeper brand interaction. Unless, of course, that hashtag is branded. Figure out which engagements you want to measure, add them all up.
When calculating the Engagement Rate, divide the engagements sum by the total number of impressions or reach (using impressions or reach is dependent on the platform and what you focus on for your brand reporting). Depending on your reporting tools, you may be able to create custom calculations to avoid doing this manually, or you can sign up for our newsletter and get access to our Engagement Rate calculator for free.
Social media analysis is part art, part science. And it’s more than just calculations. Look for the deeper story behind the numbers. Once you pair the metrics with your anecdotal knowledge and brand story, you’ll be able to make informed decisions based on real data.
And if you’re starting to question what exactly is going wrong in the art studio or the lab (to exhaust our metaphor), you can’t afford to simply hope and pray for a solution. Instead, look to the experts—maybe even an experienced team that provides valuable blog content like this…
You can contact us here, whenever you’re ready.
Originally posted September 20, 2019. Updated December 9, 2022.


